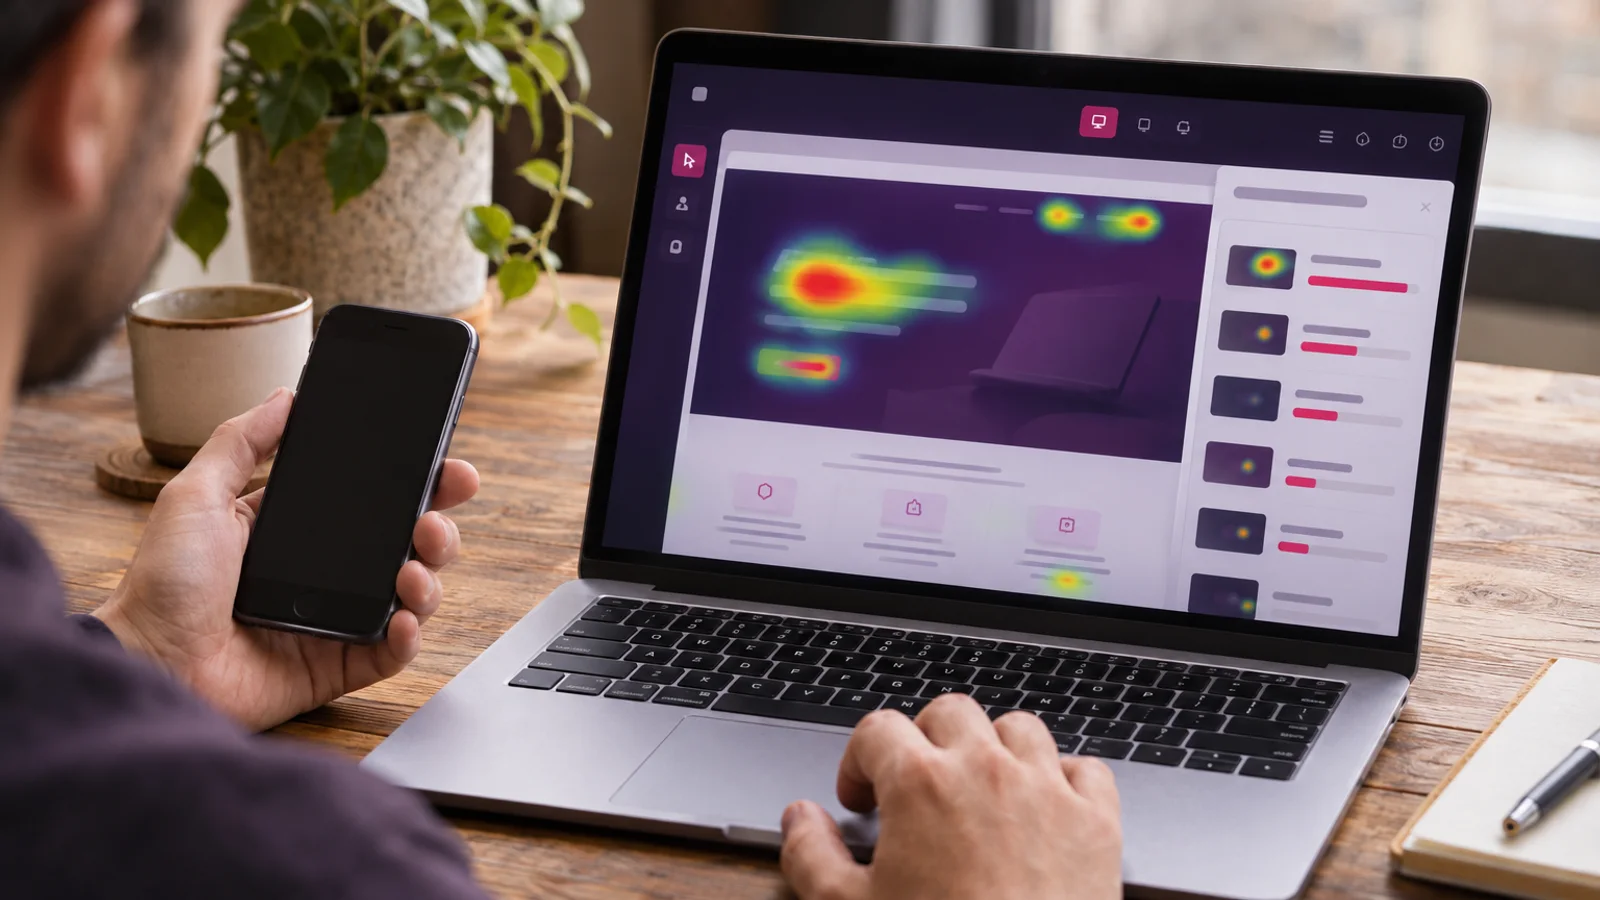
The Click Rankings panel on your pricing page heatmap puts a "Compare all features" link near the top, with plenty of clicks. On the map there is no heat anywhere near it, and you can't find the link on the snapshot at all. (Illustrative example, not customer data.)
A few replays explain it. Most of those visitors switched the plan toggle to Annual, and the link only exists in the Annual view. The snapshot was captured in the Monthly view, so the clicks are real but have nothing to land on. A tool that places clicks by screen coordinates would put the same clicks somewhere else: a warm patch on whatever sits at that spot in the Monthly view, say the plain-text line "Billed annually, cancel anytime".
This comes up often. A question on Microsoft Q&A in February 2026 describes misaligned layouts and a pop-up getting in the way of the click heatmap. The team wanted to know whether the problem was the tool or their own site. A PostHog GitHub issue from October 2025 describes clicks inside modals being recorded against the page underneath, which leaves hotspots where no visible control exists. In each case, the page in the picture is not the page visitors had in front of them. Below are the usual causes, a table of what each one looks like on the map, and a short routine for checking a heatmap against the sessions behind it.
A heatmap is many visits drawn on one captured page
Every heatmap has two layers. The bottom layer is one captured version of the page. The top layer is interactions collected from many visits over a date range, each on whatever screen that visitor happened to use. The heatmap is only as accurate as the match between those two layers.
There are two common ways to place a click on the captured page. One stores pixel coordinates and draws the dot at the same x and y. Amplitude described the weakness of that approach when it rebuilt its heatmaps in May 2026: it "worked well enough on static pages but broke predictably on anything that shifted between loads, breakpoints, or viewport sizes." The other approach finds the element that was clicked and draws the click on that element, wherever it sits in the capture.
Revisit uses the second approach. Each click is matched to the corresponding element in the snapshot, using attributes recorded with the click such as the tag, id, classes, text and parent element. The click is then placed at its relative position inside that element. When no matching element is found, the click is not drawn at all. Elements with no size in the snapshot, such as a closed menu or a hidden tab panel, are skipped during matching, so clicks on them can't be drawn either.
That changes what drift looks like. With pixel placement, a mismatch tends to show up as dots on empty space or on the wrong control. With element placement, it more often shows up as missing dots, or as an element that ranks high in the list but shows little heat on the map. Element matching can still go wrong: if another view contains a look-alike element with the same tag, classes and parent, clicks can land on it. Either way, the first question is the same. Was this the page the visitors saw?
Revisit captures snapshots in a headless browser at fixed widths: 1440 px for desktop, 768 px for tablet and 375 px for mobile. The capture waits for network activity to settle, then about three seconds more. Next it scrolls through the page within a time limit, which gives lazy content a chance to load. It also stores the page assets so the snapshot stays viewable later. That covers a lot of ordinary pages. What it can't know is which tab, modal or logged-in state your visitors were in.
Why are clicks in the wrong place on a single-page app?
A single-page app changes what's on screen without loading a new document. When it updates the address bar, it usually uses the History API. As MDN notes, "the browser won't attempt to load this URL after a call to pushState()." Many view changes don't touch the URL at all: a step in a wizard, a filter panel, a toggle between plans.
Heatmaps are usually defined by URL, so views that share a URL get merged. Amplitude's troubleshooting docs say so directly: "Heatmaps compute data per URL string, not per view. On a single-page app (SPA) where many states share one URL, a heatmap merges the clicks from all of those states into one overlay." A/B tests that serve two variants on one URL cause the same problem. Clicks from variant B get drawn on a capture of variant A, or don't get drawn at all.
On the map, merged views usually show up in one of three ways:
- clusters on text or images in the captured view that line up with controls from another view (coordinate placement)
- an element that ranks high in the list but barely shows on the map, because it only exists in the other view
- heat smeared evenly across a region where two layouts overlap
In Revisit, the URL pattern decides which pages feed a heatmap. You can match Exact, Contains, Starts with, Ends with or Regex, and for exact matches you can choose whether URLs with query strings count. If your app gives each view its own path, a tighter pattern keeps views apart. If the state lives only in memory, no URL pattern can separate it, and the replay check below matters more.
Why don't clicks on dropdowns, modals and tabs show up?
A snapshot holds one state of the page. Anything that was closed at capture time is either missing or has no size, so there's nothing to draw a click on.
Other vendors document the same limit. Hotjar's heatmap FAQ (July 2026) says the clicks and percentages "only represent elements that are visible in the screenshot," with a hover menu as the example. Microsoft Clarity's documentation (June 2026) says a heatmap "won't display clicks or scrolls collected over these dynamic elements," meaning menus that open on hover or click.
The reverse also happens. If a cookie banner, newsletter popup or expanded mobile menu was open when the snapshot was taken, it covers part of the page in the picture. Real clicks on the content underneath then have nowhere sensible to sit. One user described exactly that in a Clarity GitHub issue: popups covering the areas they wanted to study, and a mobile menu shown fully expanded.
The missing clicks are often the ones you most need. A size selector inside a modal, or a coupon field that appears after a click, is where people tend to get stuck. It's also what a default snapshot is least likely to contain.
The fix is to capture the state you want to study. Revisit's help center notes that for "pages behind login or with dynamic states, you can navigate to the exact state in the capture window before taking the snapshot." Open the modal, switch the tab, close the cookie banner, then capture. Each device can hold several snapshots, so you can keep one per state and switch between them.
Why does the mobile heatmap look nothing like desktop?
The same URL renders a different layout at each breakpoint. Element positions differ, different elements are hidden, and the fold sits somewhere else. As Nielsen Norman Group wrote in 2015, "A responsive design may have 2, 3, 4, or more different folds, specific to the devices and screen sizes that the design was optimized for."
Combining screen sizes gives you more data but less accurate positions. PostHog's heatmap docs describe that trade-off when you loosen viewport matching: "you get more data but the position might not be as accurate."
Revisit sorts interactions into device views by the visitor's recorded viewport width. Mobile covers widths up to 767 px, tablet covers 768 to 1199 px, and desktop covers 1200 px and wider. Read each one on its own.
Two details are worth knowing. First, each range is drawn on a single capture width. A visitor on a 1280 px laptop is in the desktop view, drawn on a 1440 px snapshot. If your layout changes between 1200 and 1440 px (a sidebar that appears, a grid that gains a column), those visitors saw something slightly different. Element placement absorbs most of that, as long as the clicked element exists and is visible in both. Second, the tablet range is wide. If your site switches to a hamburger menu at 1024 px, some tablet visitors saw the full navigation and some saw the menu button. The 768 px snapshot shows only one of those.
Scroll is the clearest case. A scroll depth reading only makes sense against the fold of the device it came from. Compare mobile scroll with the mobile snapshot, never with desktop.
Late-loading, changing and personalised content
Some of the page doesn't exist yet when it first appears. Images and iframes marked for lazy loading wait, in MDN's words, "until the user scrolls near them." Recommendation widgets, reviews and prices often arrive from separate requests. Mouseflow's help center points out that missing heatmap content can mean the snapshot "is taken before all the content is loaded on the page."
Late content also moves what's already there. web.dev's guide to layout shift explains that unexpected movement "usually happens when resources load asynchronously or DOM elements are dynamically added to the page before existing content." A banner that slides in at the top pushes everything down, so the page a visitor clicked two seconds in is not the page they saw at first paint.
Revisit's capture waits and scrolls so lazy sections load. It can't cover content that depends on who the visitor is: a logged-in dashboard, a region-specific price, a returning-visitor offer, an A/B variant. For those, navigate to the right state in the capture window, and accept that one snapshot represents one audience at a time.
Then there's time. Contentsquare's documentation (October 2026) states the rule well: "the screenshot you use should match the version of your page over the period you're analyzing." If the hero was redesigned on the 10th and your date range starts on the 1st, ten days of clicks are drawn on the wrong design, or dropped.
That answers a common question: do you need a new heatmap every time you change the page? Usually not a new heatmap. You need a new snapshot taken after the change, and a date range that starts after it. In Revisit you can capture a new snapshot at any time, and the snapshot list shows each capture's date and width.
What each kind of drift looks like on the map
The causes overlap, so start from what you can see. This table matches the common symptoms to a likely cause and the first thing to check.
| What you see | Likely cause | Check first |
|---|---|---|
| An element ranks high in the list but shows little or no heat | It isn't in the snapshot, or was hidden at capture | Its sessions: which view or state was open at the click |
| A section with no heat that replays show people using | It loaded late, or the snapshot predates a redesign | Snapshot date against your last deploy |
| A banner, popup or open menu covers part of the snapshot | Captured with an overlay open | Recapture with it closed |
| A Dead Clicks cluster on text, an image or a plain container | Visitors expected it to respond, a look-alike from another view, or a custom control without a button or link tag | Pause the replays at the click |
| Heat on plain text or empty space (coordinate-based tools) | Controls from another view, modal or breakpoint | Compare replays with the snapshot |
A four-step check before you act on a heatmap
None of these causes make heatmaps useless. They make a heatmap a claim that you check against the sessions it came from.
1. Pick the device view and read the snapshot label
Choose Desktop, Tablet or Mobile, not a mix. Then look at the snapshot selector, which shows when the active snapshot was captured and at what width. Compare that date with your date range and with your last deploy to the page. If the page changed after the capture, recapture before you read anything else.
While you're here, note which layer you're on. Revisit offers Clicks, Rage Clicks, Dead Clicks, Movement and Scroll, and Movement is desktop only. The Dead Clicks layer shows spots that were clicked at least twice on elements that aren't buttons, links, form controls or details/summary toggles. That makes it a good place to look for mismatches, with one caveat: a custom control built from a plain container can appear there even when it works fine. Otherwise, a dead click cluster can mean visitors expected plain content to do something, or that a control from another view landed on a look-alike element in the snapshot. Step 3 tells those apart.
2. Open the sessions behind the top element
The rankings panel lists clicked elements with click and session counts. It is built from the recorded clicks, not from the snapshot. So an element that ranks high but shows little or no heat on the map is a strong hint that the snapshot doesn't contain it. Next to each item is a Play button that opens the list of sessions that interacted with that element, and each session opens its replay.
Start with the element that would change your decision, usually the top one or the one you were about to redesign. Watch a handful of its sessions. If they agree, move on. If they disagree, keep watching until the pattern is clear, or until you can say there isn't one.
3. Compare the page in the replay with the snapshot
In each replay, pause at the moment of the click and compare the page with the snapshot. The differences that matter most:
- a modal, drawer, tab or accordion open in the replay but closed in the snapshot
- a cookie banner or popup present in one and not the other
- a different layout, which points to a width near a breakpoint
- content above the clicked element that wasn't there at capture time
- a different design, variant or logged-in state
If the replay matches the snapshot and the visitors clicked where the heatmap says, the hotspot is confirmed. If not, you've found why it was off.
4. Recapture in the right state, or mark the hotspot unconfirmed
If the mismatch is a state you can reproduce, recapture. Open the capture window, navigate to that state at the right device width, and take a new snapshot. Then read the heatmap again on the new one.
If you can't reproduce it (personalised content, an old variant, a layout only some widths get), write the hotspot down as unconfirmed and say why. That note stops someone from shipping a redesign based on clicks that belonged to a different page.
Back to the opening example. Step 1 showed a desktop snapshot taken in the Monthly view. In step 2, "Compare all features" ranked high while drawing no heat. Step 3's replays showed the Annual view at the moment of each click. Step 4 was a second desktop snapshot captured with Annual selected, after which the link's clicks appeared where the replays put them. The team could now read both plan views, each on its own snapshot. With a coordinate-based tool, the warning sign would have been a cluster on "Billed annually", and the tempting wrong fix would have been to turn that text into a link. (Illustrative example, not customer data.)
What a confirmed hotspot lets you decide
A confirmed hotspot tells you where people clicked on the page they actually had. It still doesn't tell you why. Many clicks on an element can mean interest, confusion, or a control that didn't respond the first time. Our piece on what rage clicks and dead clicks actually signal covers how to tell those apart. One replay is a starting point for that question, not proof.
The heatmap points to an element, the replays show the circumstances, and a pattern across several replays is what justifies a change. That pairing is the subject of why session replays alone aren't enough. Once a hotspot holds up, turn it into one specific fix and rank it against the rest of your list. What to fix first on your website walks through that. For checkout pages, read the steps device by device, as described in why visitors abandon checkout.
To run this check on your own site, start a free trial of Revisit, create a heatmap for your busiest page, and open the sessions behind its top element.
Frequently asked questions
Why does my heatmap show clicks on empty space or plain text?
Usually because visitors clicked something that wasn't on the captured page: a control in another SPA view, an open modal, a different breakpoint or content that loaded later. Tools that place clicks by pixel coordinates draw those clicks wherever the coordinates fall. Open the replays behind the hotspot and compare the page at the moment of the click with the snapshot.
Why doesn't my heatmap show clicks on dropdowns, modals or tabs?
A snapshot holds one state of the page. If a menu, modal or tab panel was closed when it was captured, there is nothing to draw those clicks on. In Revisit, clicks on elements that are missing or have no size in the snapshot are not drawn, although they still count in the element rankings. Navigate to the state you want in the capture window, then take a new snapshot.
Should I read desktop, tablet and mobile heatmaps separately?
Yes. Each breakpoint has its own layout and its own fold, so combining them blurs click zones and scroll depth. Revisit groups interactions by recorded viewport width: mobile up to 767 px, tablet 768 to 1199 px, desktop 1200 px and wider, with snapshots captured at 375, 768 and 1440 px.
Do I need a new heatmap every time I change the page?
Usually not a new heatmap, but you do need a new snapshot taken after the change and a date range that starts after it. Otherwise clicks from the new design are drawn on the old one, or dropped. Revisit lets you capture a new snapshot at any time and lists each snapshot with its capture date and width.
How do I check a heatmap against session recordings?
Pick one device view and confirm the snapshot date and width. Open the sessions behind the element that would change your decision. In each replay, compare the page at the moment of the click with the snapshot. Then either recapture in the right state or mark the hotspot as unconfirmed and note the reason.