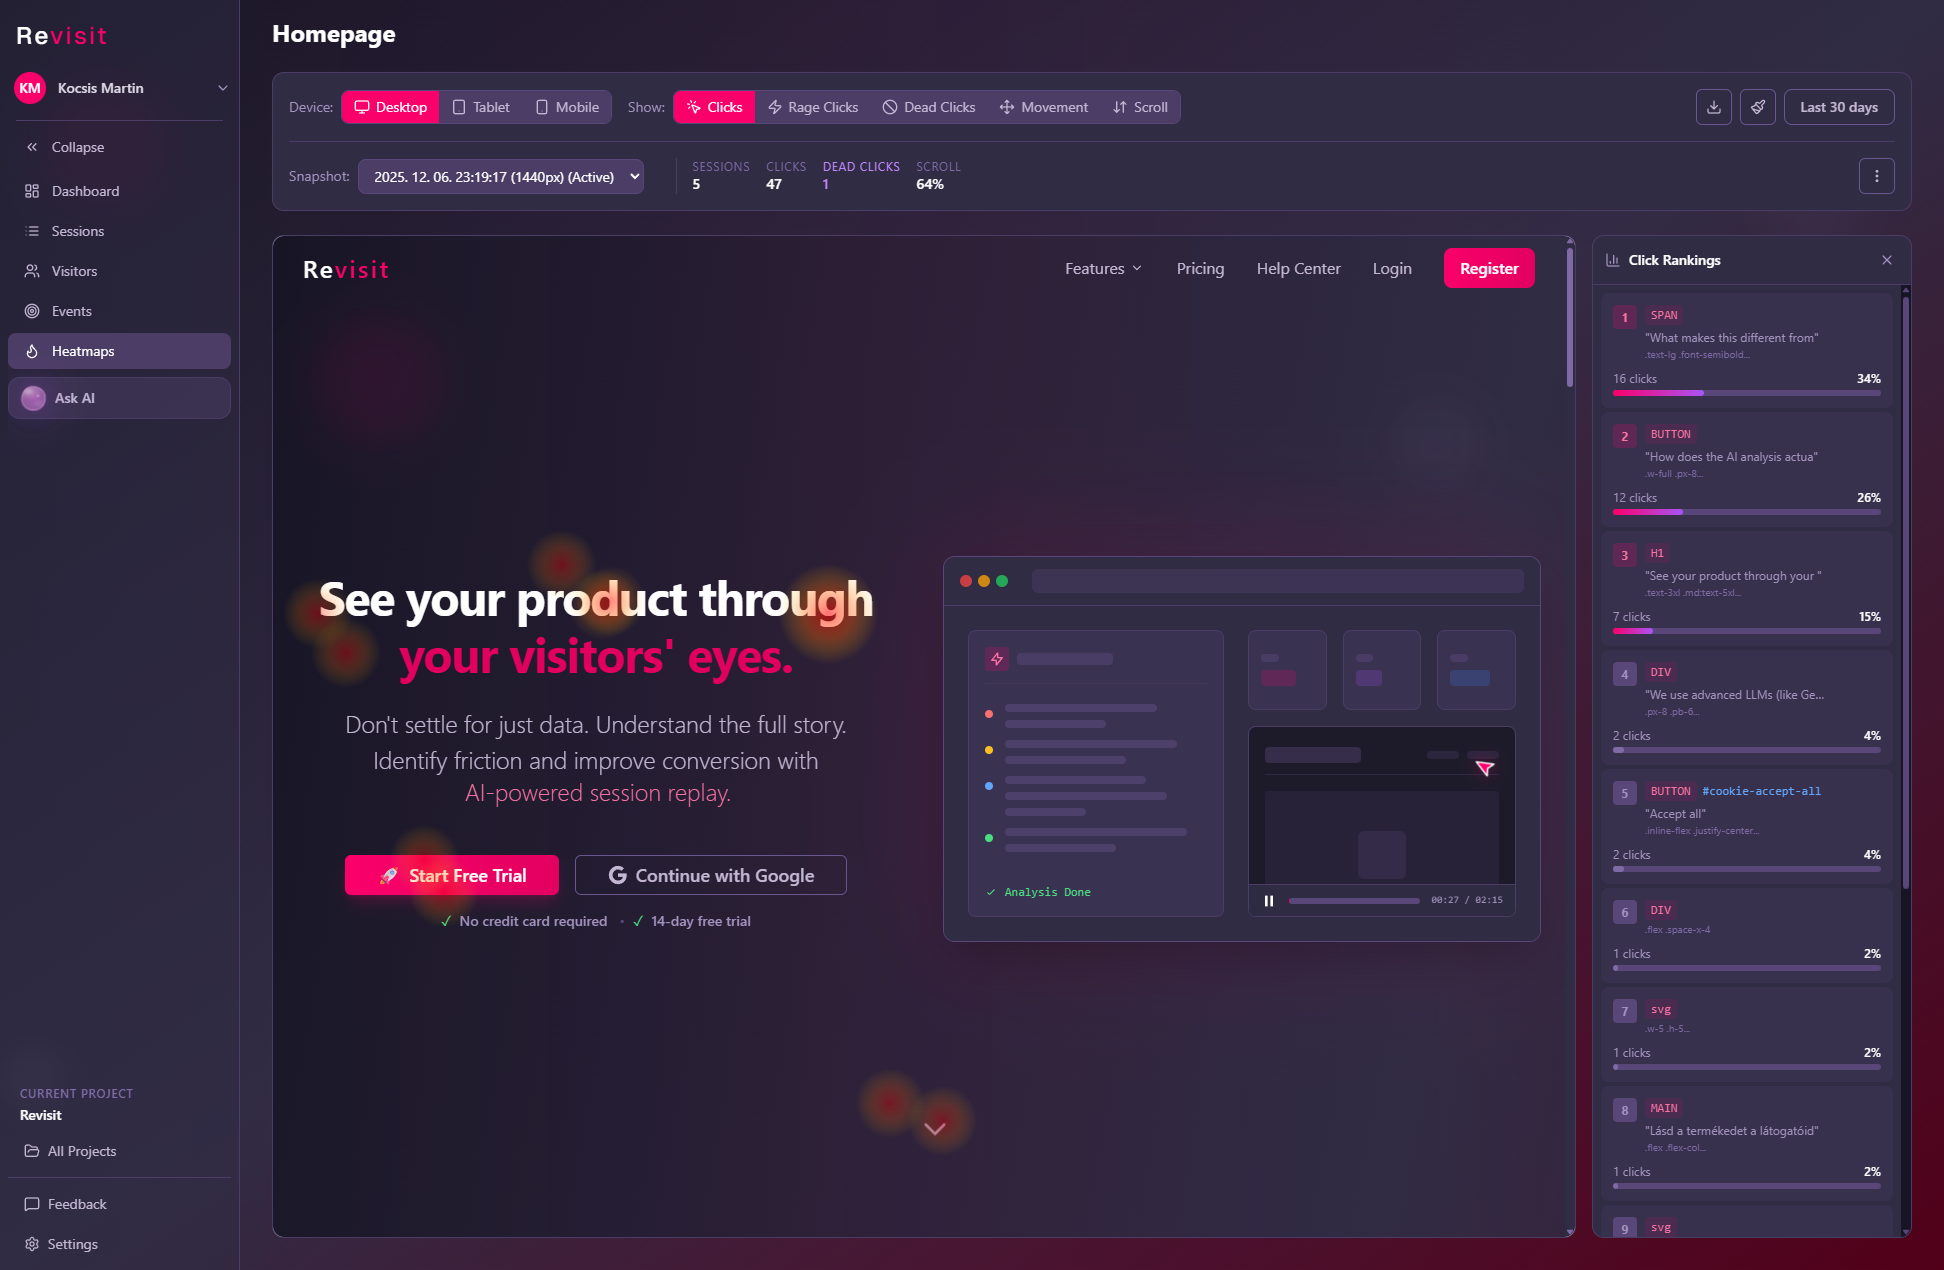
Spot the hotspots instantly
Identify your most popular content immediately. Our heatmaps aggregate thousands of interactions into intuitive visual layers.
- Click Maps: See exactly where users are clicking on your pages.
- Rage Click Maps: Instantly spot frustration. See where users are repeatedly clicking in annoyance.
- Dead Click Maps: Identify broken elements. Find clicks that don't trigger any action.
- Scroll & Move: Track exactly how far users scroll and where their mouse hovers.
AI-Powered Analysis
Don't just look at colorful blobs. Let our AI analyze your heatmaps to find hidden friction points and conversion opportunities.
- AI-Driven Optimization: Generate new HTML versions of your page based on heatmap findings.
- Visual Experiments: Let AI create screenshots of potential improvements instantly.
- Smart Suggestions: Get actionable advice on how to fix usability issues.